Most conversations about risk in short-term rentals stay at the level of intuition. Experienced operators develop a feel for which bookings make them nervous. They screen more carefully for certain guest profiles, price larger properties differently, and think twice about last-minute reservations.
That instinct is often right. But instinct is also hard to calibrate, and in some cases the data suggests the risk is sitting somewhere operators aren’t looking.
Over the past year, Truvi processed over 90,000 completed bookings across every major channel and property type. What follows is an analysis of where incidents actually occurred in that dataset: which guest characteristics, property types, and booking behaviours are most consistently associated with damage claims, and where the patterns were less obvious than expected.
A few caveats before the numbers. Single-variable findings don’t control for other factors and should be read as indicative rather than causal. Not every high-risk booking results in an incident. Not every low-risk booking is clean. The value of this kind of analysis is in understanding where risk concentrates across the market, not in predicting any individual outcome.
The guest profile picture
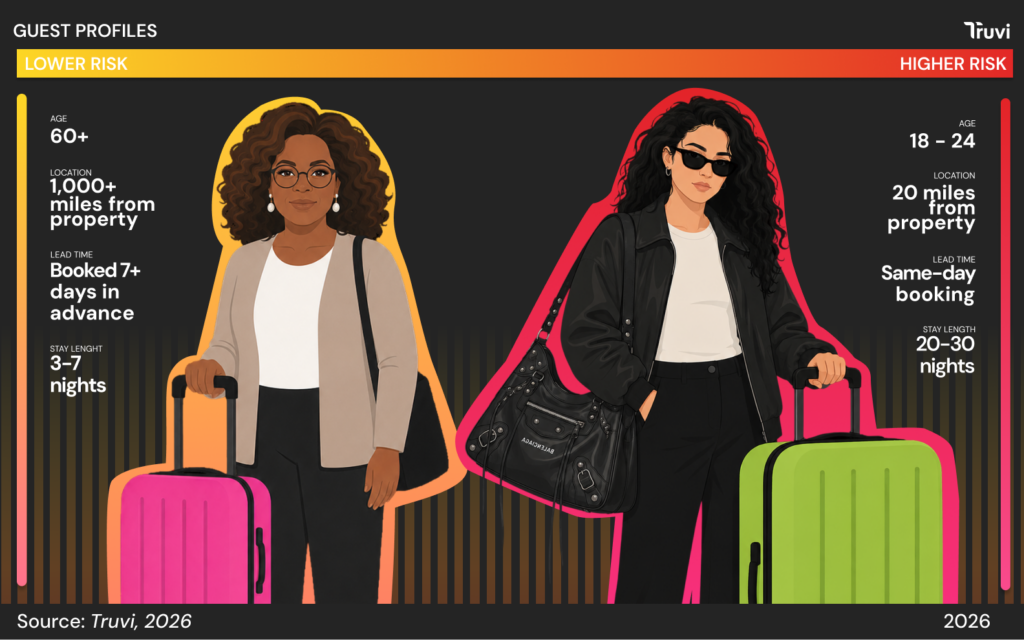
Risk doesn’t distribute evenly across guest types. Three variables show a consistent and statistically significant relationship with incident rates: age, proximity to the property, and booking lead time.
Age is one of the clearest signals in the dataset. Guests aged 18–24 carry an incident rate 44% above the platform average. Guests aged 45–59 and 60+ both sit more than 42% below it. The gradient is consistent across age bands in between.
Proximity shows that guests booking a property within 20 miles of their home carry an incident rate 80% above the platform average. Long-distance bookings, from guests travelling 1,000 miles or more, sit well below it.
Lead time follows a similar direction. Same-day bookings carry a 59% higher incident rate than average.
Stay length follows a similarly sharp pattern. Short stays sit close to the platform average, but risk climbs steeply beyond ten nights: bookings of 11–20 nights carry a 79% higher incident rate than average, and bookings of 21–29 nights carry a 164% higher rate – the largest single lift of any guest behaviour in the dataset. Extended stays often read as stable, low-maintenance bookings. The data suggests the opposite.
None of these factors operate independently. The data shows that a young guest booking a nearby property produces a risk profile substantially higher than either factor alone. The inverse is equally consistent: an older guest booking from long distance is among the lower-risk profiles in the dataset.
Property size is the dominant variable
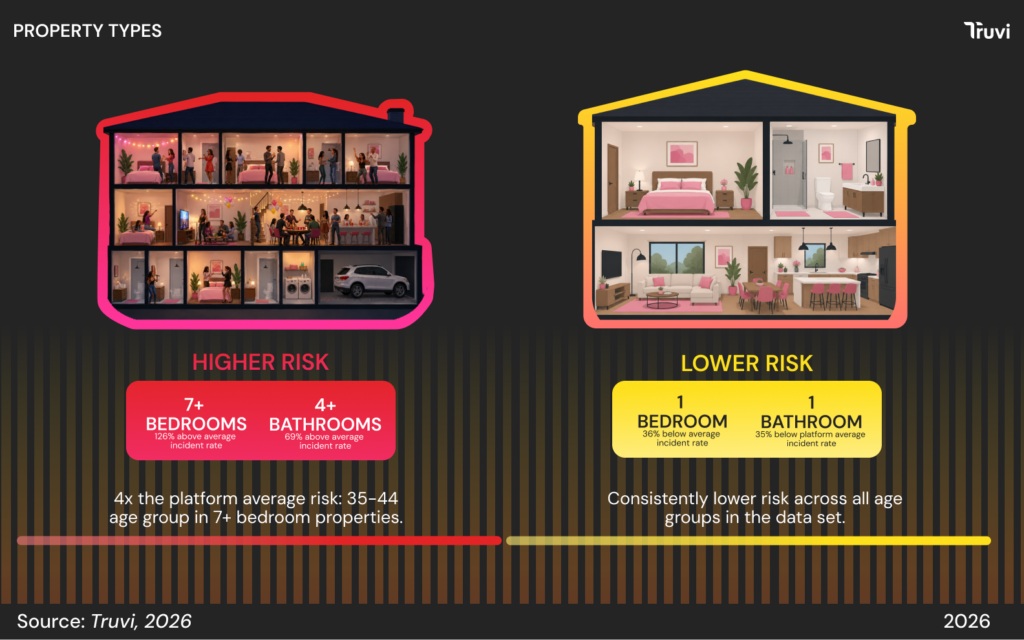
Of all the factors analysed, bedroom count has the largest effect on risk (incident rate) of any single variable in the dataset.
Single-bedroom properties sit 36% below the platform average. The rate climbs with each additional bedroom, and properties with seven or more bedrooms sit 126% above it.
Bathroom count follows a similar pattern, though it takes longer to diverge from the average: one-bathroom properties sit 35% below the platform average, and the incident rate doesn’t climb meaningfully until three or more bathrooms, rising to 54% above average at three bathrooms and 69% above average at four or more.
The interaction between guest age and property size produces some of the most striking numbers in the dataset. The highest-risk combination is guests aged 35–44 in properties with seven or more bedrooms, which produces an incident rate of 7.1%, more than four times the platform average.
One-bedroom properties show a different pattern. They remain close to the lower end of the risk range across all age groups. Small properties appear to neutralise age as a risk factor almost entirely.
Operators managing large properties face a materially different risk profile from those managing smaller ones.
Not all channels carry the same risk
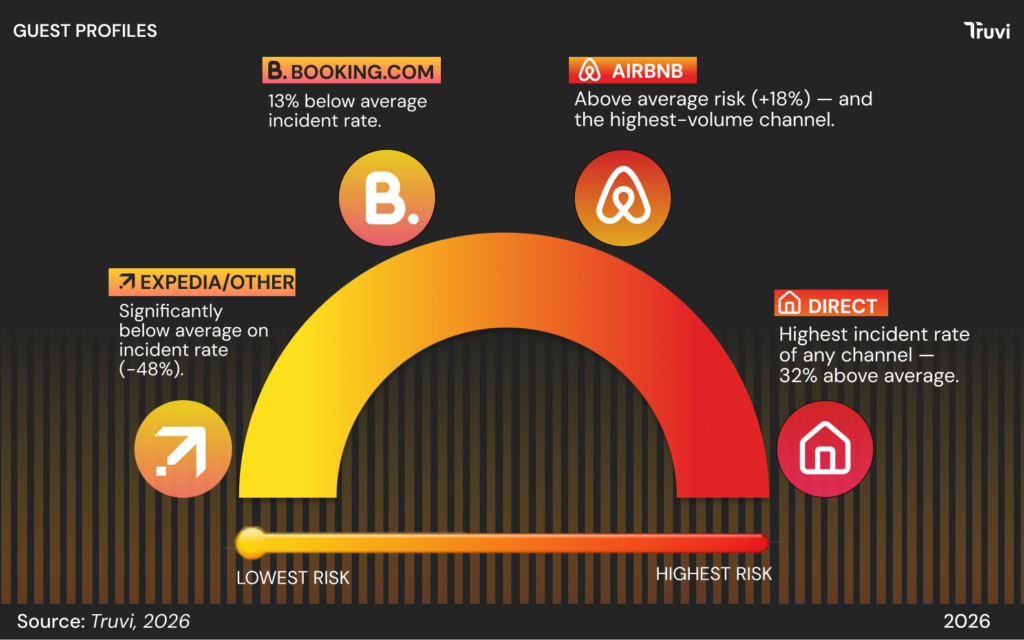
The dataset shows consistent differences in incident rates across booking channels.
Direct bookings carry the highest incident rate of any channel, at 32% above the platform average. They represent around 10.7% of all bookings in the sample.
Airbnb sits above average on both measures: 18% above on incident rate. At 40.3% of all bookings in the dataset, its aggregate contribution to overall exposure is substantial.
Booking.com represents safer bookings: -13% lower on incident rate, representing 16.5% of the analysed bookings.
Vrbo shows no statistically significant signal in either direction. Channels grouped as Other, including Expedia, sit 48% below the platform average on incident rate.
The direct booking finding is worth reading carefully. A direct channel is an increasingly important part of how operators build sustainable businesses across multiple channels. What the data shows is that direct bookings carry a different risk profile from OTA bookings, one that warrants deliberate risk management rather than the assumption that platform-level protections carry over.
A closer look at damage: a 60-day snapshot
A note on this section: the analysis below is drawn from a separate 60-day window of direct booking claims handled by Truvi’s claims team, rather than from the main booking dataset. It’s a narrower and less statistically robust picture than the figures above, and should be read as illustrative rather than definitive: a snapshot of what the damage picture looked like across direct bookings over a specific recent period.
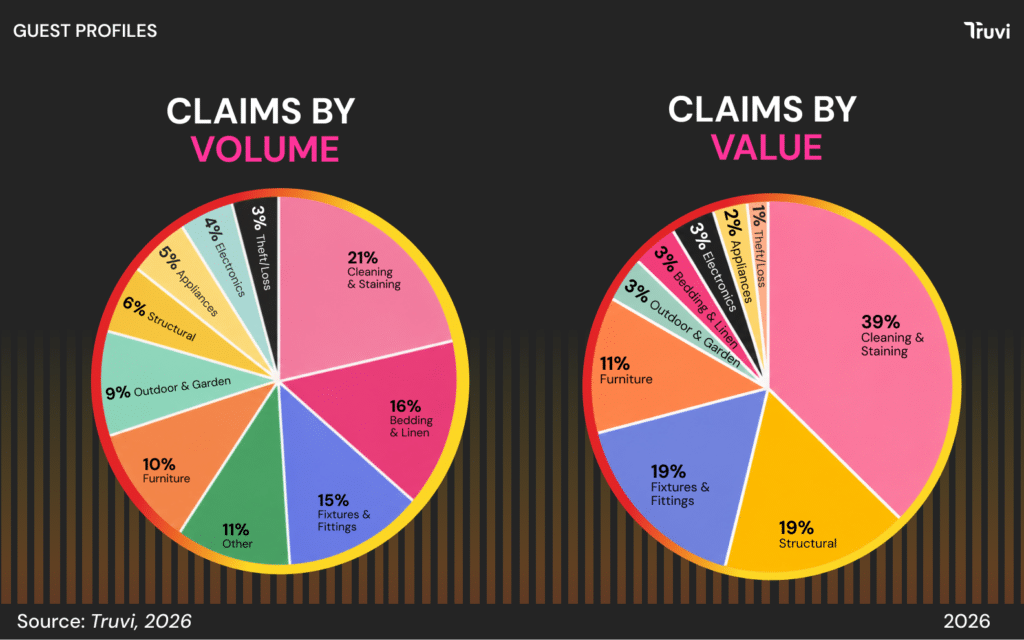
The most common damage categories by volume are cleaning and staining, bedding and linen, and fixtures and fittings, which together account for just over half of all claims filed.
The distribution of paid claim value tells a different story.
Cleaning and staining is the largest single category by paid value, accounting for around 39% of total payouts over the period. Structural damage, despite representing only 6% of claims by volume, accounts for 19% of total paid value, with an average payout of around £812 per claim, the highest of any category in the snapshot. Furniture accounts for 11% of paid value. Bedding and linen generates a high volume of claims but a small proportion of total payouts, with an average of around £59 per claim.
The gap between claim frequency and claim value is most pronounced at the extremes. Bedding and linen is the second most common category by volume, but its share of total paid value is small relative to that frequency. Structural damage sits at the opposite end: low volume, high paid value.
What the data points to
The clearest finding across all of these variables is that risk factors compound. No single signal tells the full story, but multiple signals in combination produce a meaningfully different risk profile from any of them in isolation.
Every booking carries some level of risk. Some bookings that look low risk will still result in incidents. Some that carry multiple risk factors will not. What the data does is give operators a clearer picture of where that risk tends to concentrate, rather than where it’s assumed to sit.
This analysis is based on 91,451 completed bookings processed through Truvi’s platform. Findings are generated at a 95% confidence level.
Know where your risk sits
Truvi screens every booking automatically, flagging the signals that matter before guests arrive, and protecting you when something goes wrong. Across every channel, including direct.