
TL;DR: ADR (Average Daily Rate) shows what you charge per booked night. RevPAR (Revenue per Available Room) shows actual revenue efficiency across all available nights, combining both pricing and occupancy. High ADR means nothing if occupancy is low. Track both metrics together to optimize your pricing strategy, then protect those earnings with proper guest screening and damage protection.
Your nightly rates look good, but your revenue doesn’t match up. Or maybe your calendar is full, but you’re barely breaking even. The problem isn’t always what you’re charging or how often you’re booked — it’s understanding how these two factors work together.
RevPAR (Revenue per Available Room) and ADR (Average Daily Rate) are the metrics that show you what’s actually happening with your rental income. One measures what you charge per booking, the other shows whether those bookings translate into real revenue. Most hosts track one or the other. A smart vacation rental pricing strategy combines both metrics with data-driven decisions.
This guide explains what each metric means, how they affect each other, and how to use them to make better pricing decisions for your vacation rental.

What is ADR (Average Daily Rate)?
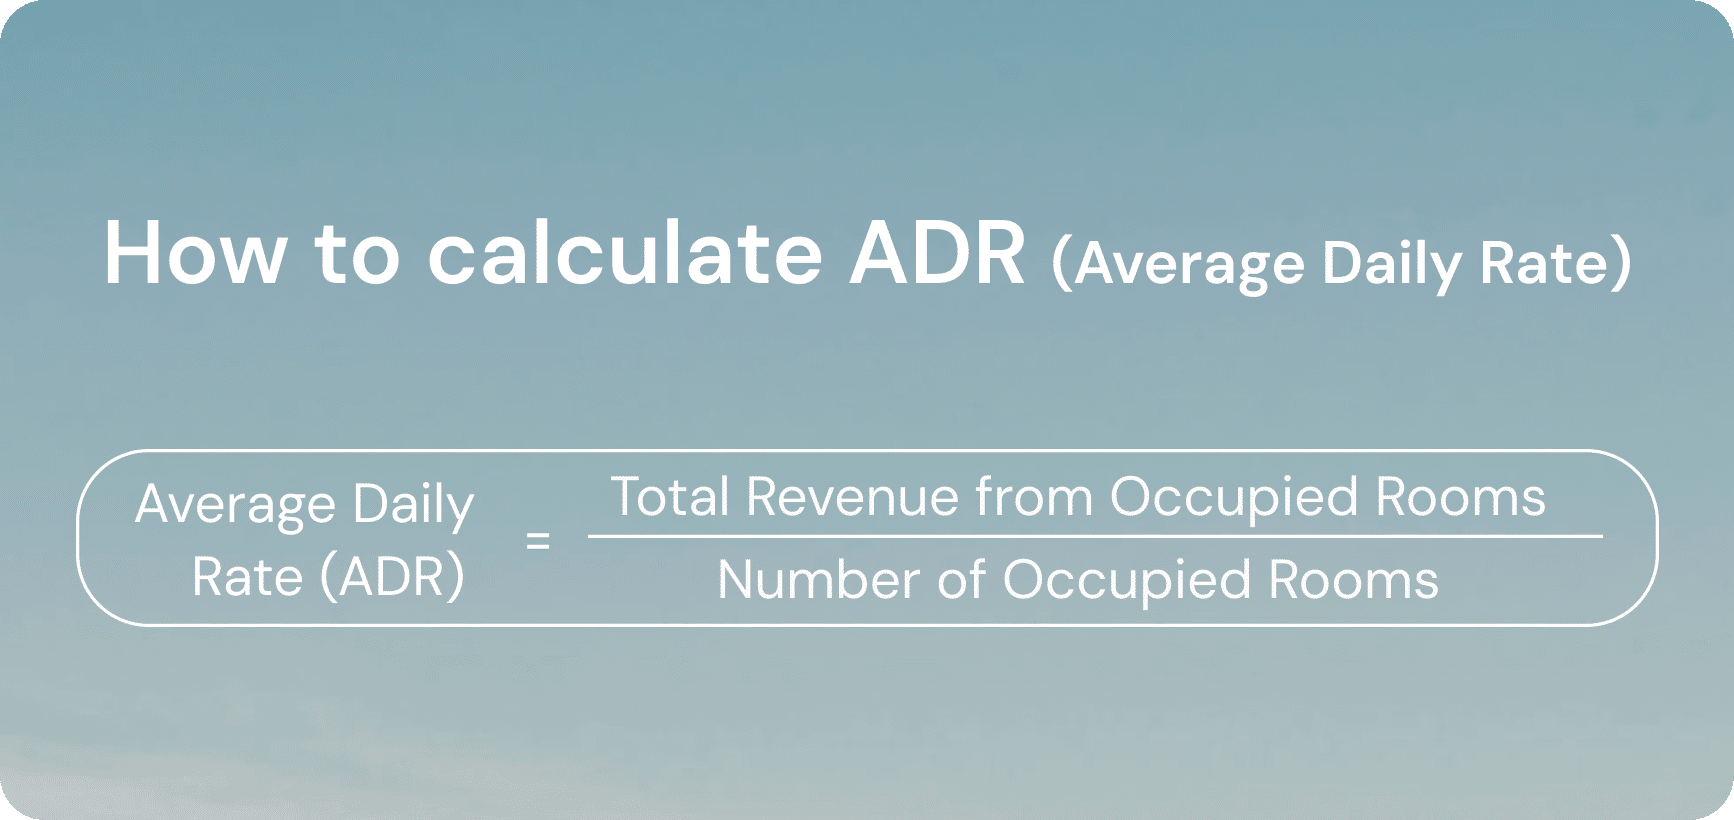
ADR is a metric showing the average price of an occupied room. You add up the number of occupied rooms or nights in a specific period, calculate the generated profit, and determine the average income per booked room or night. ADR shows how well you approach dynamic pricing for vacation rentals and whether the nightly rates are high and competitive enough.
ADR formula
To calculate the ADR, you must know the total revenue and the number of booked rooms (for hotels) or nights (for platforms like Airbnb). You can retrieve this data from the property management system or track it manually if you don’t use one. Once you gather this information, divide the total room revenue by total rooms or nights sold.
ADR calculation example
Let’s say you run a 3-bedroom apartment with all rooms rented for 16 nights during one month (30 days). The total booking revenue from those nights is $3,520. Then, the average daily rate is $3,520 ÷ 16 = $220.
What influences the ADR of vacation rentals
Average daily rates shouldn’t be the only information source to guide your ADR revenue management strategy, as they’re affected by many external factors:
- Economic landscape. Recession periods result in lower average daily rates and weaker opportunities to increase pricing.
- Seasonality. ADR may be lower in low seasons and higher during holidays, summer, festivals, and local events.
- Location. Guests are willing to pay more for nice views and proximity to the beach or city center. Places at the outskirts usually have lower rates.
- Market segment. Business travelers and those who can afford premium properties are ready to pay more for extras. Consider your property type and features when setting rates. You might want to add amenities that let you charge more.
- Guest reviews and quality. Bad reviews affect the number of bookings as well as your ADR. Properties that attract reliable, verified guests can often charge higher rates.
- Dynamic pricing automation. The use of dynamic pricing tools can make vacation rental revenue management smarter. Combined with a solid vacation rental pricing strategy, these tools help you balance rates and occupancy. But with wrong settings, they may harm profitability. Learn more about dynamic pricing for vacation rentals and how to configure tools for your market.
You must always consider a broader picture and ensure that higher rates generate higher revenue to find the balanced price for your rentals.
Insights you can get from average daily rates
Regular ADR tracking helps evaluate pricing effectiveness. The metric is a core part of ADR revenue management and shows whether your rates are competitive and actually generating the earnings you expect per room or night. You can also see the impact of the changes you make, like whether offering a discount for a 5+ day stay increases the number of booked nights.
ADR allows for tracking property performance over time. You can see the impact of micro and macroeconomic changes, market trends, and demand fluctuations on the income to stay afloat and find ways to thrive.
What is RevPAR (Revenue per Available Room)?
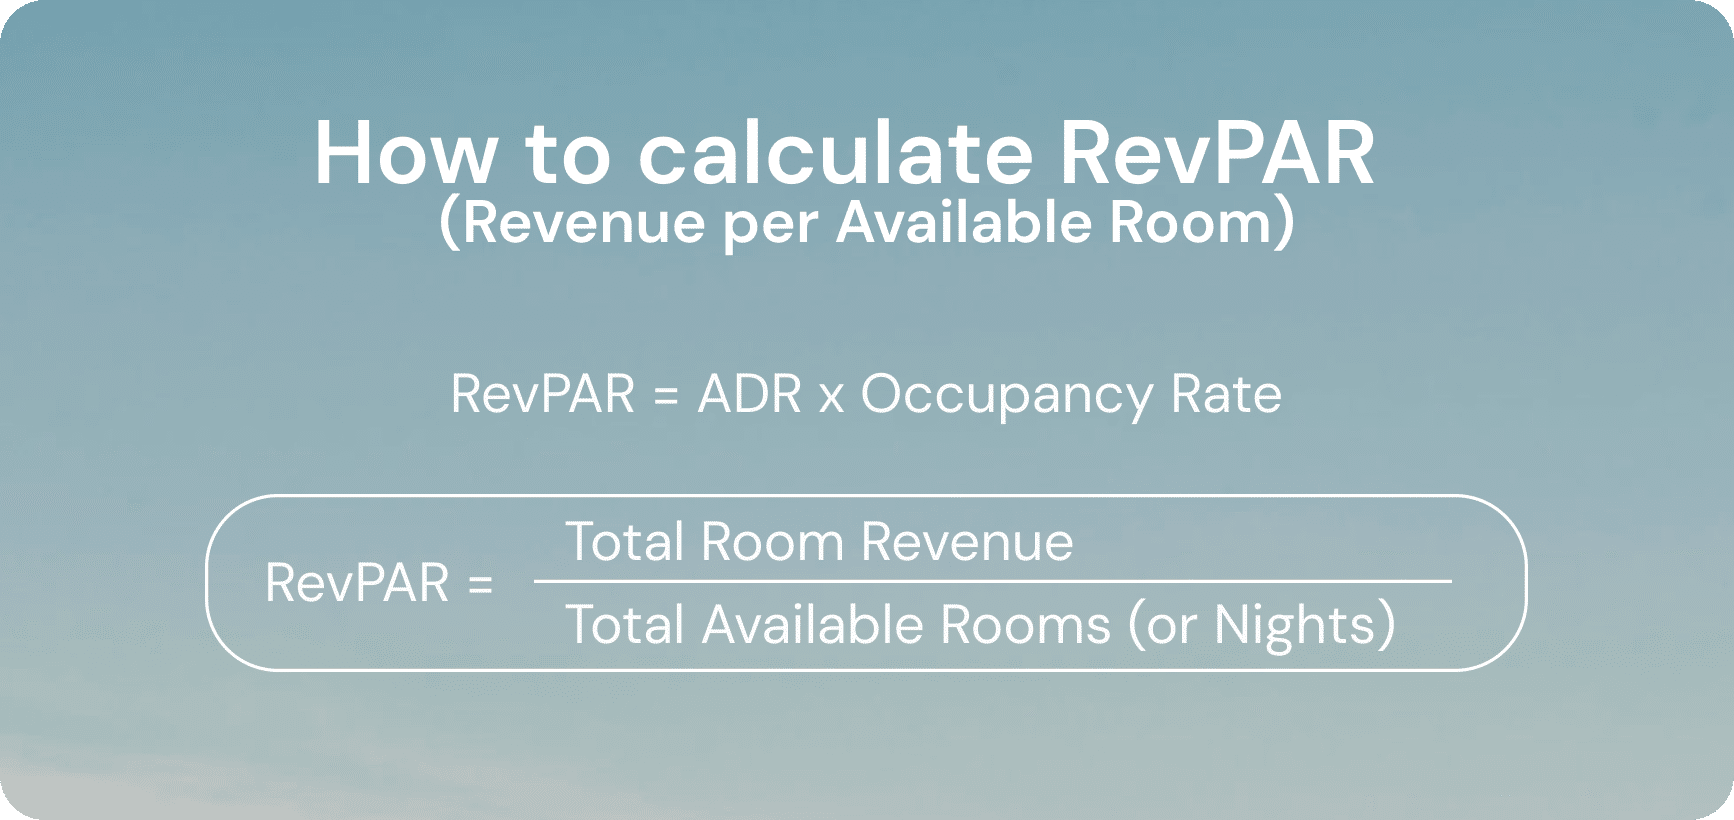
RevPAR is a rental metric that shows the revenue generated per room or night, regardless of whether it’s booked or not. To calculate it, you must know the total room revenue and the number of rooms you rent (for hotels) or nights (for an Airbnb unit). RevPAR enables hoteliers and property managers to track occupancy trends and the effectiveness of their pricing approach.
RevPAR formula
There are two ways to calculate the revenue per available room. One is based on ADR and occupancy, and another divides the total revenue by the number of available rooms or nights. You can use whichever is more convenient for you.
Note that if you calculate the RevPAR for an Airbnb unit, you should replace the number of available rooms with total nights in a given period (it’s usually 30 days).
RevPAR calculation example
When calculating RevPAR with total room revenue and the number of available rooms or nights, you only need to summarize the monthly revenue. The number of nights in a month is unchanged (30 nights). With the total revenue of $1,950 from an Airbnb unit, the RevPAR is $1,950 ÷ 30 nights = $65.
If you calculate RevPAR using ADR, you also need to know the occupancy. Suppose you run an Airbnb property that has an ADR of $100 with 65% occupancy. The RevPAR is $100 × 0.65 = $65.
Same result with different approaches.
What influences the Revenue per Available Room
Revenue per Available Room is not a standalone metric, and must be considered with many other factors, such as:
- Average daily rate. Higher rates with the same occupancy result in increased RevPAR. At the same time, inflated ADR can reduce occupancy and, consequently, lower the RevPAR.
- Occupancy rate. RevPAR is directly proportional to the percentage of nights booked. Poor occupancy will lower the revenue per available room even if the daily rates are high.
- Demand. Higher demand allows hosts and property managers to increase rates without losing occupancy, and vice versa.
- Property condition and damage costs. Unexpected damage from problem guests can eat into your RevPAR if you’re not protected against repair and replacement costs.
Since RevPAR and ADR are intertwined, all the factors influencing the average daily rate also affect the revenue per available room, including seasonality, property type, location, market segment, economic trends, and guest reviews.
Insights you can get from RevPAR
RevPAR evaluates the real performance of a rental unit. It accounts for all available booking slots, not just the nights guests have booked. So, if one has high nightly rates, but the occupancy is too low to generate decent profits, RevPAR helps capture this.
You can also measure the RevPAR of your competitors to benchmark against them and find ways to optimize your pricing approach. Another RevPAR use case is forecasting. Knowing fluctuations in your revenue per available room, you can predict the expected income for upcoming seasons more accurately.
RevPAR vs. ADR differences and how these metrics affect each other
Hosts and property managers should measure both the average daily rate and revenue per available room. When combined, these metrics give a fuller perspective on the effectiveness of your pricing approach. They enable property managers to evaluate different aspects of rentals. ADR shows whether your rates are high enough, while RevPAR tells if these rates are fair and if guests are ready to pay them. Simply put, ADR focuses on pricing, and RevPAR measures efficiency.
| ADR (Average Daily Rate) | RevPAR (Revenue per Available Room) | |
|---|---|---|
| Definition | Average revenue per room/night sold | Revenue per available room/night (sold and unsold) |
| Focus | Price per booking | Revenue efficiency |
| Influenced by | Mainly room rates | Both occupancy and room rates |
| Usage | Build a pricing approach and evaluate revenue per booked night | Measure overall financial performance and revenue potential with current occupancy |
| Value Comparison | Usually higher than RevPAR | Usually lower than ADR |
How RevPAR vs. ADR affect each other
Average daily rate directly impacts the revenue per available room or night. The higher the ADR, the better the RevPAR (given that occupancy remains the same). Here are some common scenarios:
- Effective pricing approach: Increase in ADR with stable occupancy = increased RevPAR.
- Low revenue due to overpricing: Steep increase in ADR with lower occupancy = possibly lower RevPAR.
- Discounts bring more bookings: Lower ADR with higher occupancy = possibly higher RevPAR.
- Reduced rates fail to boost bookings: Lower ADR with stable occupancy = lower RevPAR.
Tips on growing your revenue based on RevPAR vs. ADR metrics
Tracking these metrics enables property managers to see the outcomes of different pricing approaches and respond dynamically. If you find that price adjustments do not boost income, try our tips to make things work.
Add value to your property and measure the change
If occupancy remains low and continues to impact revenue, consider improving your property’s design or amenities to attract more guests. This move can bring you more positive reviews that will also increase occupancy. You can draw some inspiration from popular rentals in your area and analyze what makes them so magnetic.
Continuously monitor the metrics
Occasional RevPAR vs. ADR tracking won’t provide you with reliable information on your rental performance. You must gather information for multiple seasons to see how the revenue and occupancy change under different conditions. It’s also helpful to run experiments and measure RevPAR vs. ADR afterward to see the real effect of different approaches.
Review and minimize other expenses
If your RevPAR vs. ADR rates are high, but there are too many hidden expenses, the actual income from short-term rentals may be modest. Or worse, you may even start losing money. Since the net revenue is usually more important than gross, you should write down all your monthly expenses and see what can be optimized.
Many hosts underestimate the negative impact of property damage that is slowly draining their budgets. Damage protection services can help you minimize these expenses and get coverage for different types of damage. It will shield you from upsetting issues with guests and increase the profitability of short-term rentals.
Automate routine operations
Low RevPAR vs. ADR may require a more strategic approach than changing prices. The use of professional software is another way to improve the quality of short-term rentals and, therefore, attract more guests. Consider implementing dynamic pricing software, property management systems, and tools for automated guest verification and screening. It will attract high-paying guests who value good service and are willing to spend more.
Turn metrics into profit
Understanding these metrics helps you spot problems. Strong ADR but weak RevPAR? You have an occupancy issue. Solid RevPAR but low ADR? You’re underpricing. Track both to see the full picture of your rental performance.
But here’s what these numbers can’t tell you: how much revenue you’ll actually keep. Problem guests and unexpected damage can quickly hurt your profits, regardless of strong ADR or RevPAR performance. Bad guests don’t just cause damage — they hurt your reviews, which directly impacts your ability to charge competitive rates. When guests cause problems or damage your property, it affects both your ADR (through poor reviews) and RevPAR (through lost bookings during repairs).
Guest Screening catches fake accounts and problem guests before they book. When you consistently host quality guests, you maintain better property conditions and reviews, which lets you charge higher rates. Damage Protection up to $1M covers everything from small spills to major incidents. A single major incident can wipe out months of RevPAR gains — protection ensures you get reimbursed directly instead of paying repair costs out of your rental income.
Protect your rental revenue
Screen guests before they arrive and get up to $1M coverage for damage. Track your metrics, then protect them.